AI Chart Tool

What Happened to ChartGPT.dev? The Rise and Quiet Fall of a Hackathon Darling
Ever stumbled upon a tool that felt like magic—transforming your plain text into slick, ready-to-share charts—only to find it seemingly vanished overnight?
If so, you might be thinking about ChartGPT.dev. Born in the golden age of AI experimentation, this promising open-source project drew attention for making data visualization effortless using nothing more than natural language. But fast forward to 2024 and beyond, and things have gone quiet—too quiet.
So what happened to ChartGPT.dev? Did it shut down, implode, or just drift into obscurity?
The short answer: It didn’t officially shut down, but it may as well have. The site is technically still online, but the project shows all the signs of being unmaintained and abandoned. No updates. No support. No roadmap.
Read on to unpack the full story—from how ChartGPT.dev came to be, to why its creator moved on, and how similar tools managed to grow while it faded.
What Was ChartGPT.dev?
ChartGPT.dev was an AI-powered web app that turned simple text prompts into attractive data visualizations. You could type something like “Bar chart of company revenue from 2018 to 2022” and it would automatically generate a ready-to-share chart using natural language processing and OpenAI APIs.
Key facts:
- Founded: Early 2023
- Creator: Katrin Reznykova (aka @whoiskatrin on GitHub)
- Tech stack: React, Next.js, Tailwind CSS, OpenAI
- Open Source: Hosted on GitHub, with 3.6k+ stars and 346 forks
- Origins: Originally built for a hackathon and published on Devpost in Feb 2023
Its simplicity and accessibility made it a quick hit in AI and data science communities, especially among non-technical users who wanted to create charts without fiddling with Excel or writing code.
Why Did ChartGPT.dev Fail?
Short Answer:
ChartGPT.dev didn’t officially shut down, but it became functionally abandoned due to lack of maintenance, monetization, and strategic direction.
Long Answer: A Perfect Storm of Startup Pitfalls
While the project never publicly declared a shutdown, several factors contributed to its slow fade from the limelight:
Limited Market Fit Beyond Early Buzz
Early adoption was high—especially during the spike of interest in AI-powered tools in 2023. But like many hackathon-style projects, it struggled to mature into a long-term product. Charts were beautiful, but the platform lacked deeper customization features, data uploads, or integration capabilities needed for real-world business use cases.
No Monetization Path
Unlike its cousin [ChartGPT.io], which monetized with tiered pricing, ChartGPT.dev remained free and open-source. While that transparency was admirable, it also meant the developer likely bore any hosting and API costs herself. Without a revenue plan, growth was inherently capped.
Crushing Competition in a Crowded Space
AI-generated charts became a trend, with similar or more robust tools popping up, including:
VizGPT
Kanaries.ai/chartgpt
Power BI with AI plug-ins
Auto-GPT and AgentGPT use cases for visualization
These tools didn’t just do similar things—they did more. Greater functionality, better user interfaces, and commercial support meant users naturally drifted away.
Developer Moved On
The creator, while clearly talented, shifted focus. GitHub activity suggests she turned energy toward other projects like SQL Translator (which has more stars and attention). With no active roadmap or community engagement, ChartGPT.dev quietly slipped into “archival” mode.
Underfunded and Unscaled
There’s no record of VC funding or accelerator involvement. While many AI tools secure grants or seed funding, ChartGPT.dev didn’t pursue external capital—likely by choice. But this meant no team, no marketing budget, and eventually, no updates.
Timing and Tech Fatigue
In 2023, everyone wanted to jump on the AI wave. By mid-2024, this gold rush started to wane. Users became more selective as novelty wore off, and unless a tool had staying power or deep integrations, it risked becoming a one-trick pony.
ChartGPT.io vs ChartGPT.dev: A Tale of Two Directions
Interestingly, a similarly-named service—[ChartGPT.io]—appeared soon after, offering the same premise: "text-to-chart" visualizations.
But unlike the original .dev
version, ChartGPT.io went commercial:
- Offers subscription plans ($4.99 to $14.99 monthly)
- Has a polished user interface
- Handles advanced features like table summarization
- Actively supported and marketed
There’s no confirmed link between the two, but the comparison is telling.
What ChartGPT.io did differently:
- Focused on usability for business analysts, not just hackers
- Monetized early to offset costs
- Maintained consistent updates and community engagement
- Established a commercial identity, not just GitHub code
This “fork in the road” reflects a common theme in tech: the line between innovation and productization is thin. Great ideas need follow-through, or someone else will bring your vision to market—for a price.
Final Thoughts: A Soft Fade, Not a Hard Fall
ChartGPT.dev never officially died—it just stopped evolving.
In many ways, this is the fate of countless hackathon gems: launched with excitement, embraced by early adopters, then set aside as the next shiny tool comes along.
Still, ChartGPT.dev deserves credit. It showed what was possible when powerful APIs met clean UI/UX. It empowered non-coders. It sparked forks and clones. And it proved once again that good ideas don’t always guarantee long-term success without structure, sustainability, and support.
Ultimately, ChartGPT.dev didn’t crash. It coasted—a ghost ship still online, but with no one at the helm.
FAQs about ChartGPT.dev
Who founded ChartGPT.dev?
ChartGPT.dev was created by developer Kate Reznykova (known online as @whoiskatrin), originally for a 2023 hackathon.
When did ChartGPT.dev come out?
The project launched in early 2023, with its initial release publicly posted in February via Devpost and GitHub.
When did ChartGPT.dev shut down?
There’s no official shutdown date. As of early 2025, the website is still accessible, but the project appears abandoned and unmaintained.
How much funding did ChartGPT.dev raise?
There’s no record of funding. It seems to have been bootstrapped and open-source from the start.
Why did ChartGPT.dev fail?
It gradually faded due to lack of monetization, product maturity, and long-term vision. The creator likely moved on, and no new maintainers took over.
Is ChartGPT.dev still online?
Yes, the site remains live, but updates ceased around late 2023, making it effectively a legacy project.
If you're still out there, ChartGPT.dev—we salute you. You may be quiet now, but your code still speaks.
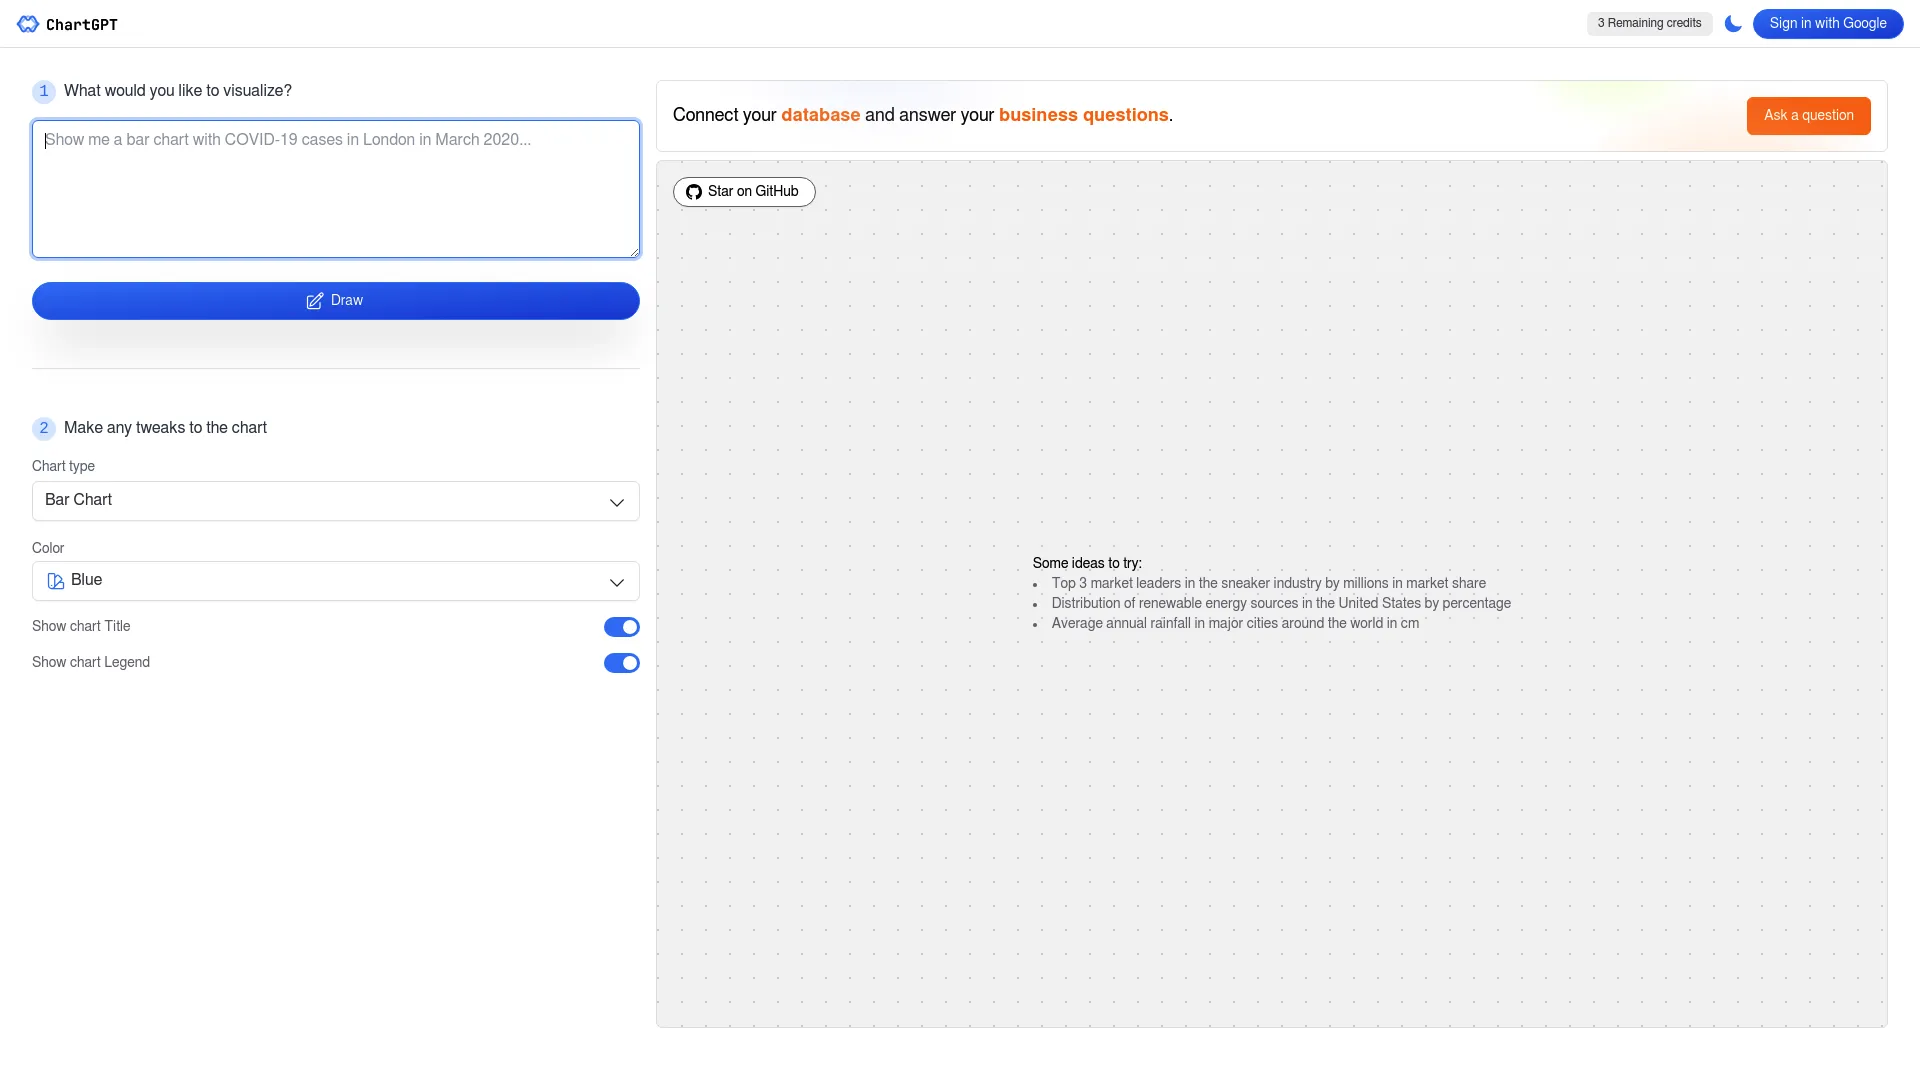
What is chartgpt.dev?
Chartgpt.dev is an online platform designed to facilitate the creation of charts based on textual descriptions. Users can input their data along with the desired chart type, and the website employs an artificial intelligence model to generate visualizations. Beyond chart creation, Chartgpt.dev offers additional functionalities such as sparking creativity, acquiring new knowledge, or simply enjoying data-related activities. This platform leverages technologies like React, Next.js, OpenAI, and Tailwind CSS for its operations.
How much does chartgpt.dev cost?
Chartgpt.dev is a web platform that provides a chart and graph generation service based on natural language input. This service relies on ChatGPT, an AI model developed by OpenAI, to interpret user instructions and generate corresponding charts. Notably, it offers a free plan permitting up to 10 chart creations monthly and a premium plan priced at $9.99 per month, which grants users unrestricted chart generation. Additionally, Chartgpt.dev asserts its uniqueness as the pioneer and sole service utilizing ChatGPT for chart production.
What are the benefits of chartgpt.dev?
Chartgpt.dev offers several advantages:
- Ease of Use: Users can easily generate visualizations by describing their data and desired chart in natural language. The tool then creates the visualization accordingly, making it accessible to users with varying technical expertise.
- Advanced AI Models: Chartgpt.dev leverages cutting-edge artificial intelligence models, including OpenAI and PaLM, which excel at understanding natural language and translating it into visual charts. This ensures accurate and efficient chart generation based on text input.
- Open-Source and Free: The tool is both open-source and freely accessible online at chartgpt.dev. Users also have the option to download the source code from GitHub and run it locally on their own machines, providing flexibility in how they use the tool.
- Versatility and Customization: Chartgpt.dev offers a wide range of chart types, such as bar charts, pie charts, line charts, scatter plots, and more. Users can further customize their charts, including adjusting colors, labels, titles, and other visual elements, allowing for creative and tailored visualizations.
How accurate are the charts generated by Chartgpt.dev?
Chartgpt.dev's generated charts come with a caveat regarding their accuracy. These charts are produced by an artificial intelligence model that, like any automated system, can potentially make errors or misinterpret input text. The website explicitly states that these charts are intended primarily for entertainment purposes and advises against relying on them for serious analysis or decision-making processes.
Despite this disclaimer, some users have found value in the charts generated by Chartgpt.dev. They report that these charts can be surprisingly useful for swiftly visualizing data. The accuracy of the generated charts may hinge on several factors, including the clarity and quality of the input text, the complexity and type of chart requested, and the availability of relevant data sources.
One notable feature of the website is its provision for users to edit and customize the charts after generation. This feature holds the potential to enhance both the accuracy and visual appeal of the charts, as users can refine them to better suit their specific needs and preferences.
Can I use my own data with chartgpt.dev?
Certainly, chartgpt.dev allows users to utilize their own data for chart creation. As indicated on the website, users have the flexibility to supply their own data sources through two methods: by either performing a drag-and-drop action for CSV file uploads or by manually inputting the data. Once the data is provided, users can interact with the API through natural language commands to generate and enhance charts based on their specific data sets. For instance, users can issue commands such as 'Remove gridlines' or 'Change all colors to gradients of green' to customize the appearance of their charts according to their preferences.
Why is ChartGPT not currently accessible?
ChartGPT is not accessible at the moment due to the status message indicating "This Deployment has been disabled." This error means that the host's deployment services have been turned off, possibly due to billing issues as suggested by the "402: PAYMENT_REQUIRED" error code. Implicitly, this points to a need for the website owner to address payment to reactivate the service.
What should visitors do if ChartGPT is unavailable?
If visitors find ChartGPT unavailable due to the "Deployment Disabled" message, they have a couple of recommended courses of action. Firstly, they can attempt to contact the website owner to report the issue or inquire about the service's status. Alternatively, they can revisit the site later after giving the owner time to possibly resolve any underlying issues with the deployment.
What does the 402: PAYMENT_REQUIRED error mean for ChartGPT?
The "402: PAYMENT_REQUIRED" error encountered on ChartGPT signals that there's a billing issue preventing deployment from operating. This typically suggests that payment is due for the service to resume. If you encounter this error, it would be best to contact the service owner for clarification or wait for the issue to be resolved.