Piechartmaker.co
Create Pie Charts with AI
Create piecharts in seconds
What does Piechartmaker.co do?
How do I create a 3D pie chart using Piechartmaker.co?
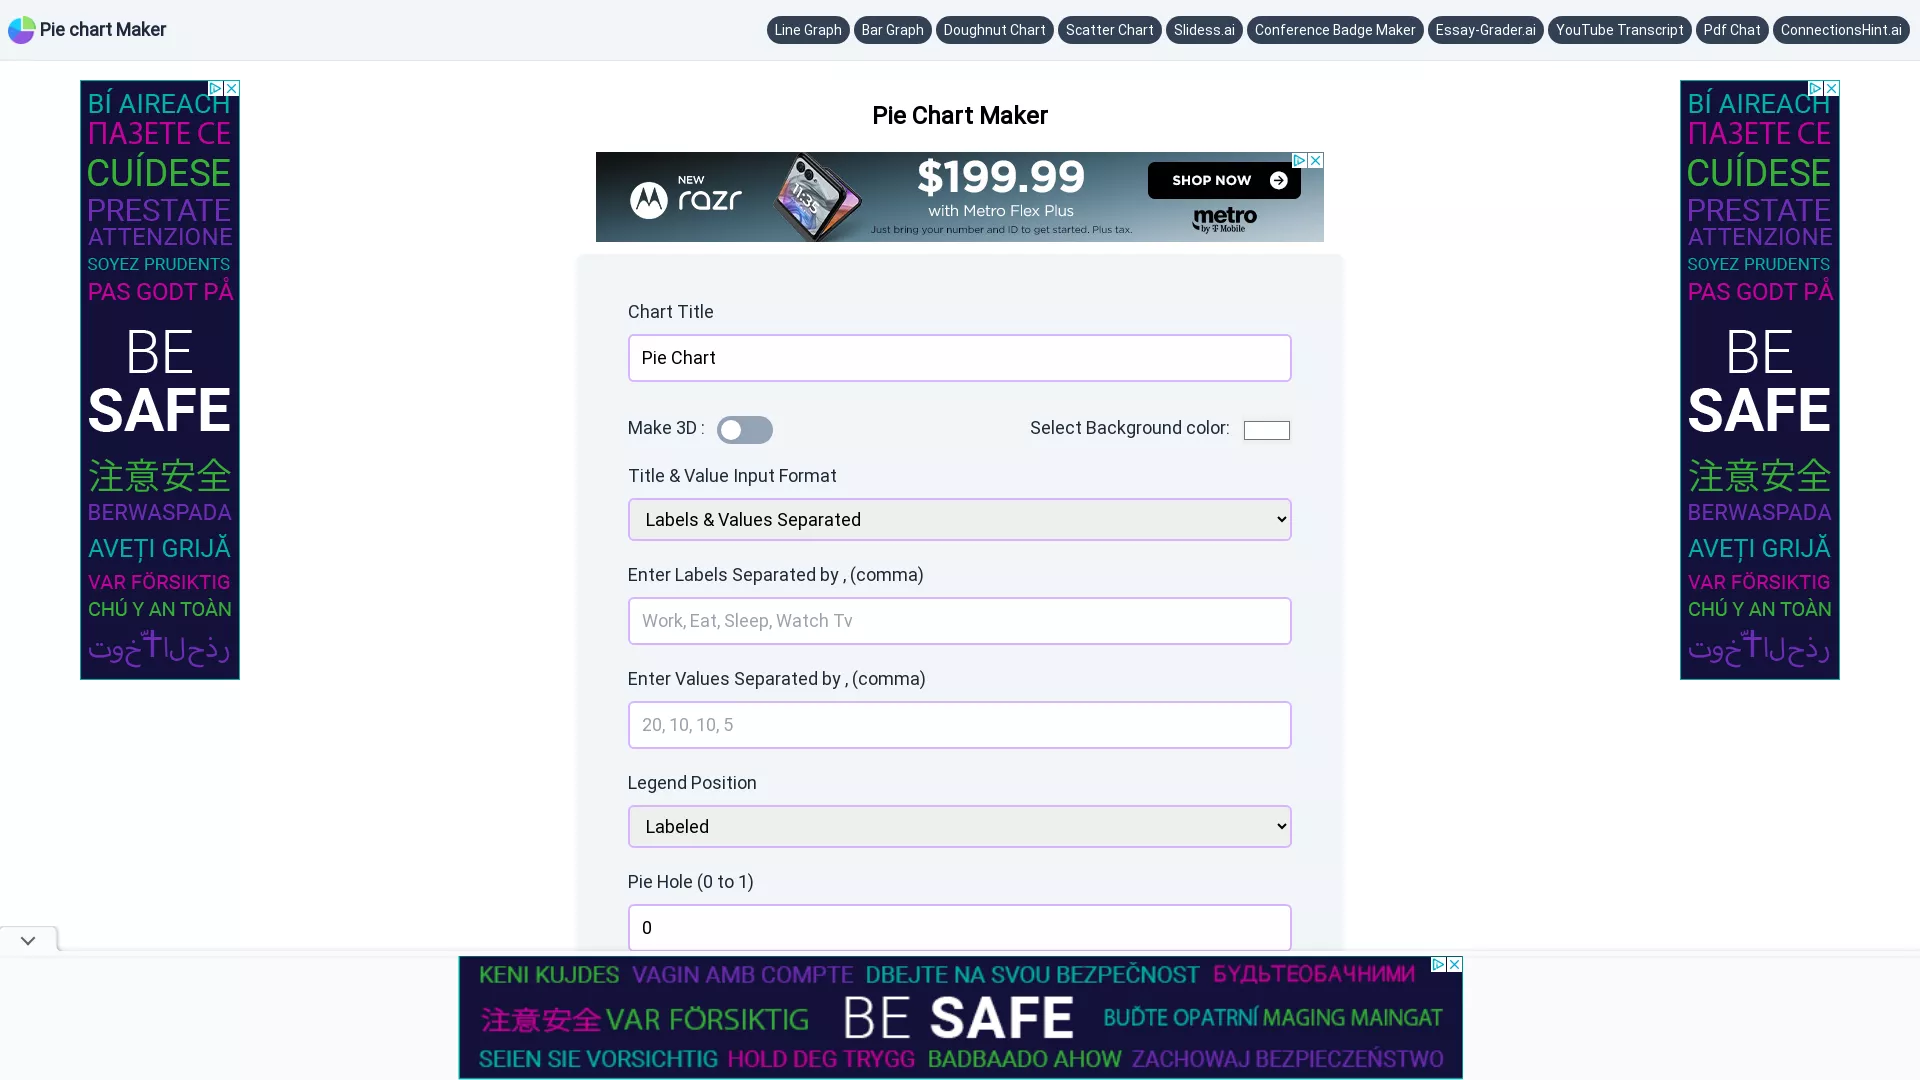
To create a 3D pie chart, first enter your data by typing the labels separated by commas and the corresponding values separated by commas. Then enable the 'Make 3D' option with a single click. You can customize other settings such as background color, title color, and legend position as needed. When you're ready, click 'Generate Graph' to create your 3D pie chart, which you can download in JPG, PNG, or SVG format.
Can I create a doughnut chart with Piechartmaker.co?
Yes. You can make a Doughnut chart with one click. A doughnut chart is essentially a pie chart with a hole in the center, adjustable via the Pie Hole setting (0 to 1).
Can I customize the colors of my pie chart?
Yes. You can change the background color, the title color, and the legend color to match your preferences.
How should I input data for labels and values?
Enter labels separated by commas and the corresponding values separated by commas.
What formats can I download my pie chart in?
You can download in JPG, PNG, or SVG formats.
What chart types are available on Piechartmaker.co?
The Pie Chart Maker focuses on pie charts (including 3D pie charts and doughnut charts). The site also lists tools for Line Graph Maker, Bar Graph Maker, and Scatter Chart Maker as other chart options.
What is a Pie Chart?
A pie chart is a visualization in which the entire circle represents 100% and is divided into pieces according to the percentages of each data point. It’s best for small data sets. A doughnut chart is a doughnut-shaped variant with a hole in the center.
What options are available for pie slice label text?
Pie Slice Text options include Percentage, Value, Label, or None.
What legend positions can I choose, and can I rotate the chart?
Legend can be positioned at Top, Bottom, Left, Right, or None. You can also rotate the chart from 0 to 360 degrees.