Chartz
AI Data Visualization
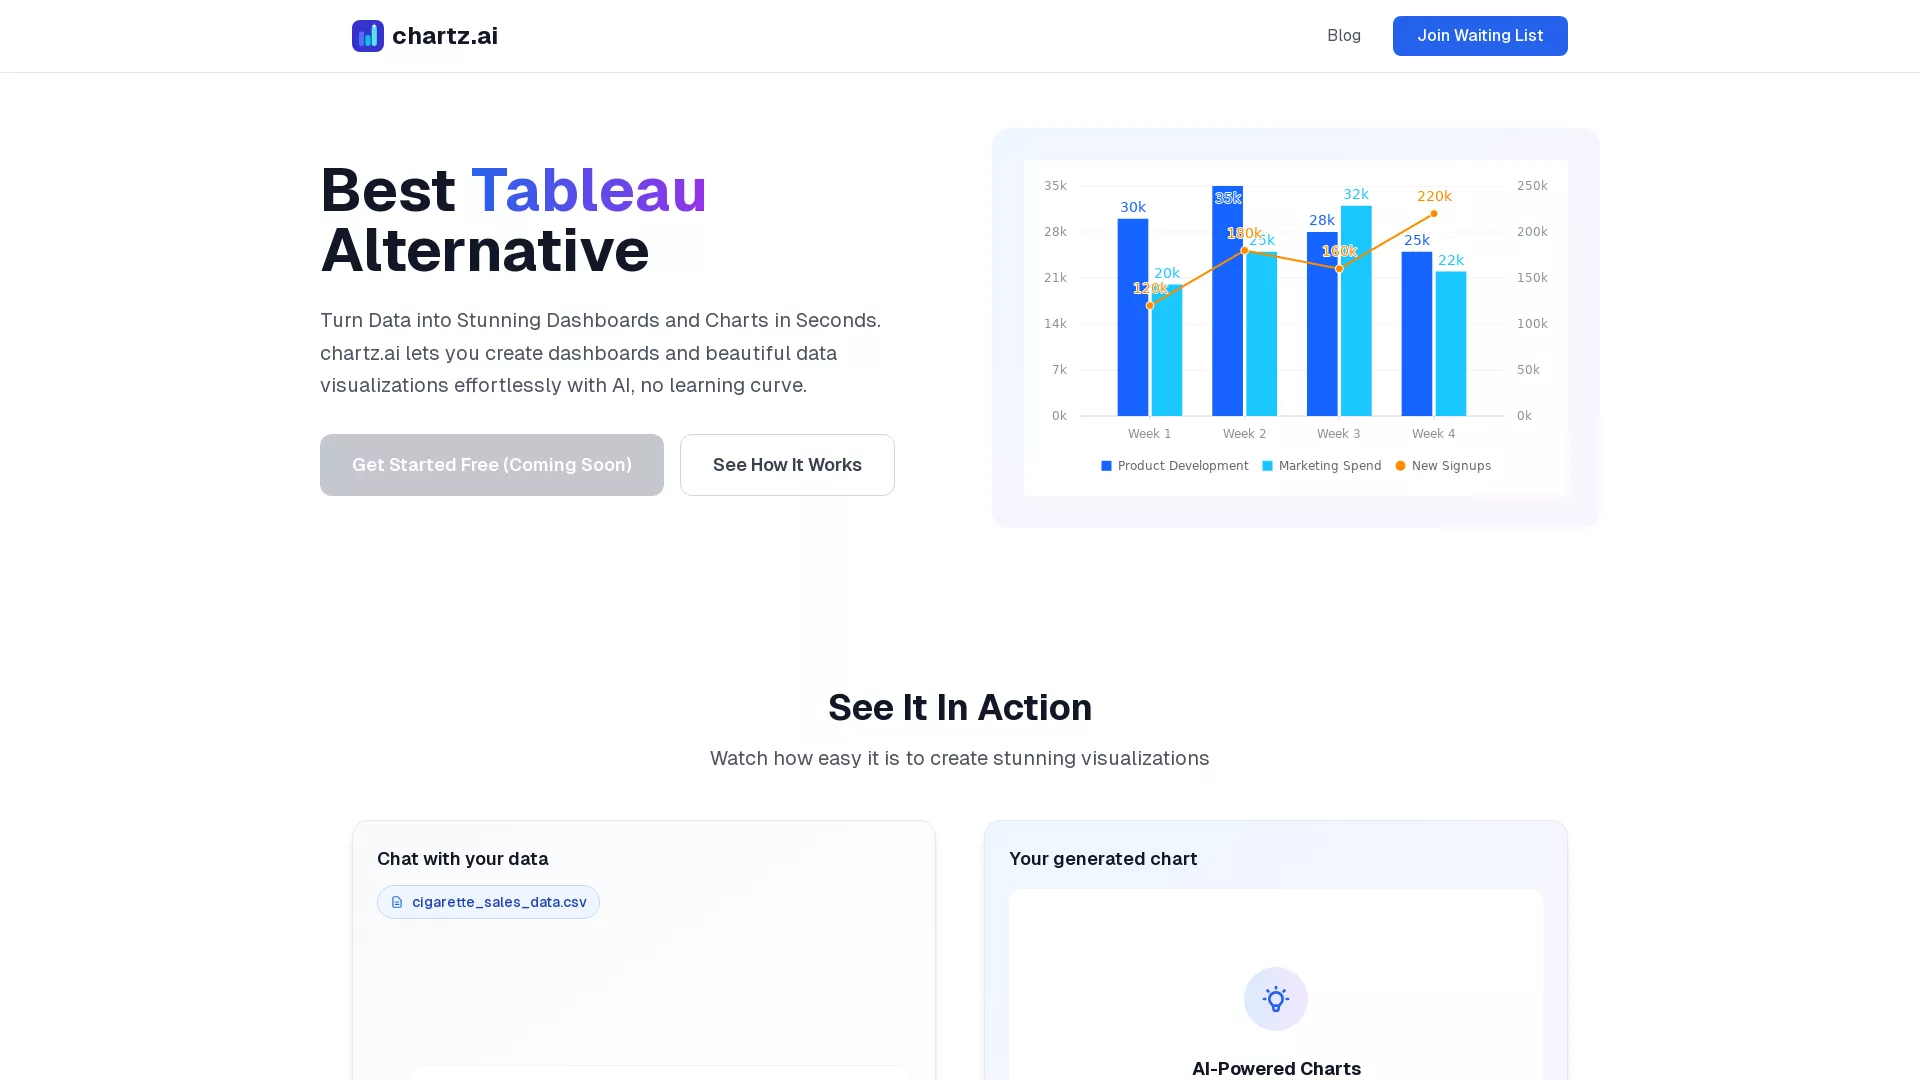
Turn Data into Stunning Dashboards and Charts in Seconds.
What does Chartz do?
What is the main use case for Chartz?
Transform your data into comprehensive dashboards with multiple charts, KPIs, and insights - all from natural language prompts.
Who is the target audience of chartz.ai?
People that need to analyze data. Chartz.ai lets you create dashboards and beautiful data visualizations effortlessly with AI, no learning curve.
What is the cheapest pricing package Chartz offers?
Freemium
How Does Chartz AI Help in Creating Stunning Data Visualizations Effortlessly?
Chartz AI revolutionizes data visualization by leveraging artificial intelligence to turn complex datasets into stunning visualizations with ease. Users simply provide natural language prompts, and Chartz AI analyzes the data to create the most suitable visualization. This eliminates the learning curve, making it an ideal tool for anyone looking to produce high-quality dashboards and charts quickly.
What Makes Chartz AI the Best Alternative to Tableau for Data Visualization?
Chartz AI stands out as the best alternative to Tableau due to its intuitive AI-driven approach, allowing users to create dashboards and data visualizations in seconds without prior experience. It supports a wide range of chart types and can handle complex data structures. Additionally, it offers real-time updates, multi-dimensional analysis, and full customization options, making it a versatile tool for businesses and data professionals alike.
How Can Chartz AI's Multi-Chart Dashboards Benefit Business Insights?
Chartz AI's multi-chart dashboards enhance business insights by consolidating various visualizations, KPIs, and data sources into a single, unified view. This comprehensive approach allows businesses to monitor real-time performance metrics, uncover trends, and make informed decisions. The tool's AI-powered capabilities enable detailed analysis and visualization of complex datasets, fostering a deeper understanding of business operations and growth opportunities.