Open Charts
Openai Charts AI Api Usage Tracker
Track and Optimize OpenAI Usage with OpenAI Charts: The Ultimate AI API Usage Tracker
What does Open Charts do?
How does Open Charts help monitor OpenAI API usage and spending?
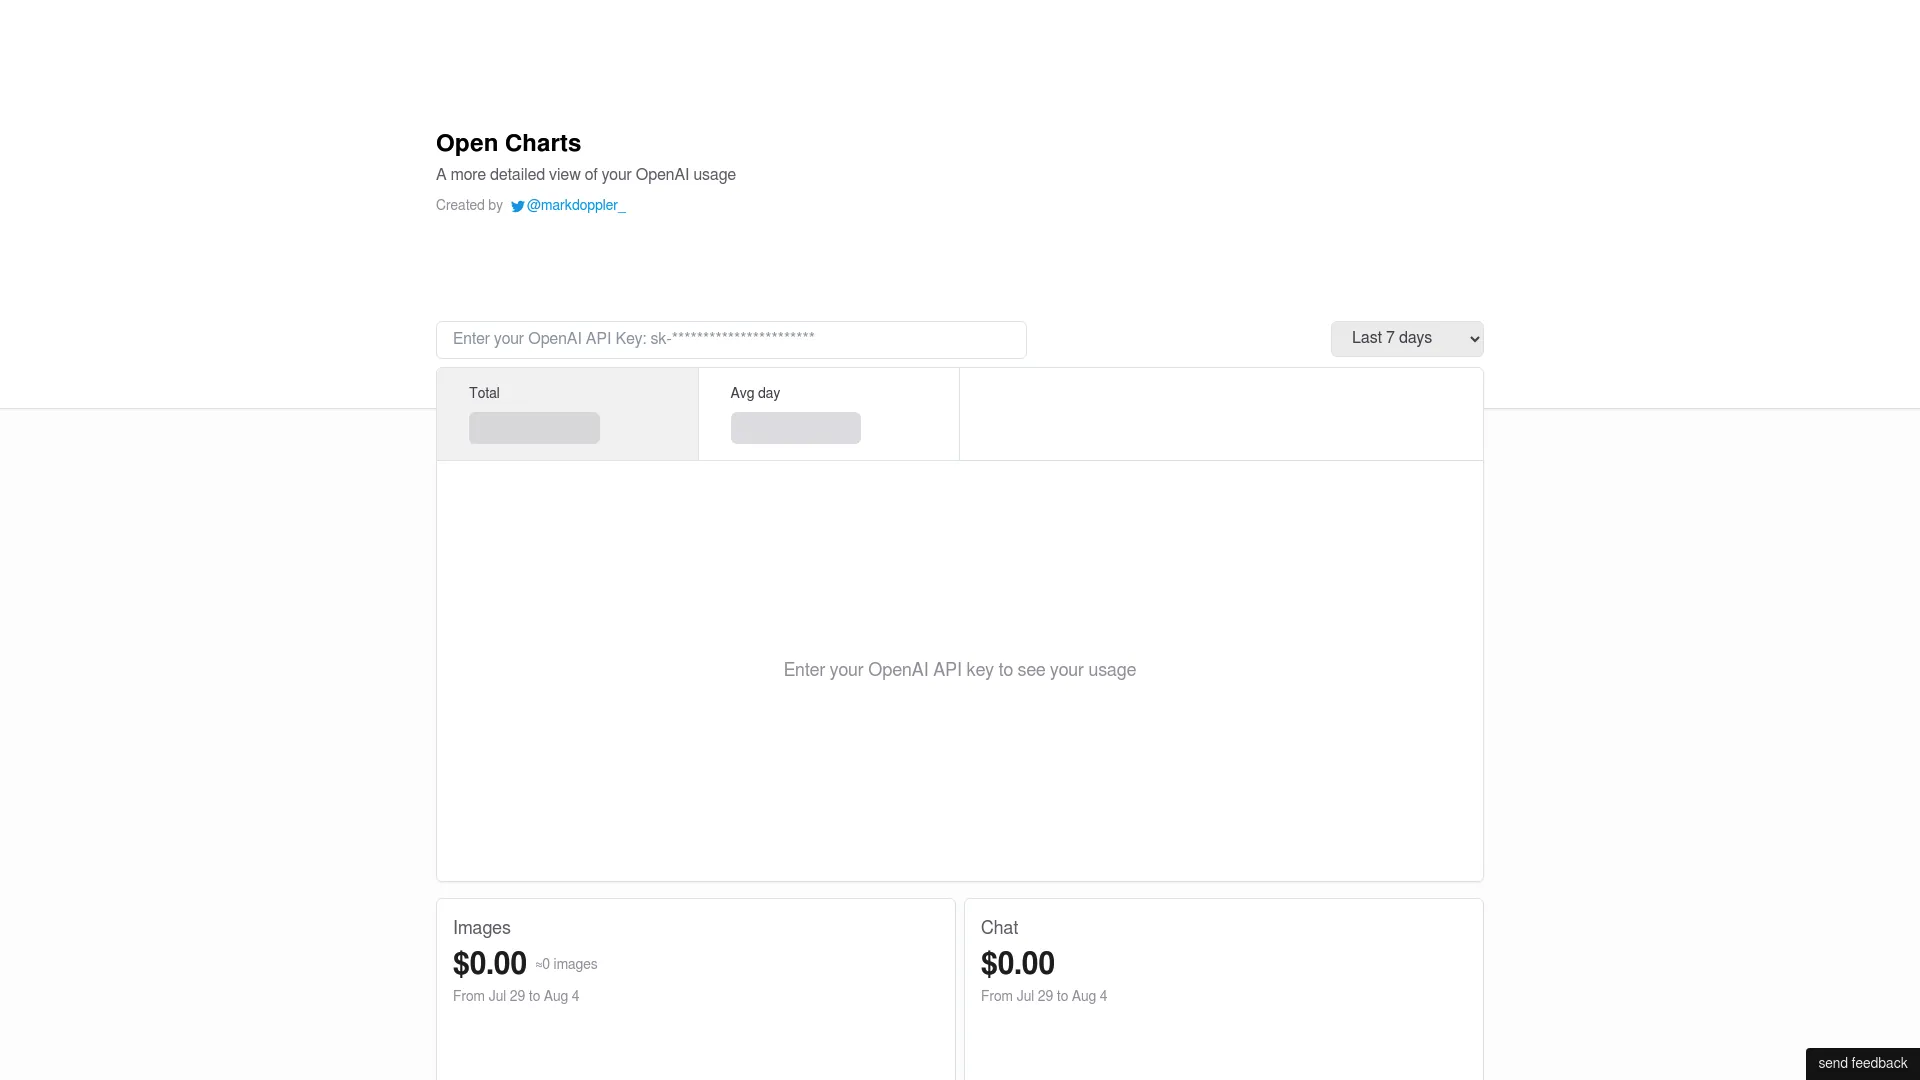
Open Charts provides a clear, category-based view of your OpenAI usage. By entering your OpenAI API key, you can see your consumption across multiple timeframes (last 7 days, last 14 days, last 30 days, last 2 months, and last 3 months). It breaks down usage into categories such as Images, Chat, Embeddings, and Instruct models, and for each category and timeframe it shows the total cost and the approximate usage amount, with an indication of average daily usage to help you spot trends and manage costs.
Do I need to enter my OpenAI API key to see usage in Open Charts?
Yes. To view your usage, enter your OpenAI API key. Once entered, Open Charts will display your usage across the selected timeframes and categories (Images, Chat, Embeddings, Instruct models), including cost and approximate usage.
What usage categories does Open Charts track, and what data does it show for each category?
Open Charts tracks Images, Chat, Embeddings, and Instruct models. For each category, it shows the cost incurred and the approximate usage over the chosen timeframes, helping you understand consumption patterns and manage expenses.