Line Graph Maker
Chart and graphs maker
Easily create linegraphs in seconds.
What does Line Graph Maker do?
How do I create a line graph with Line Graph Maker?
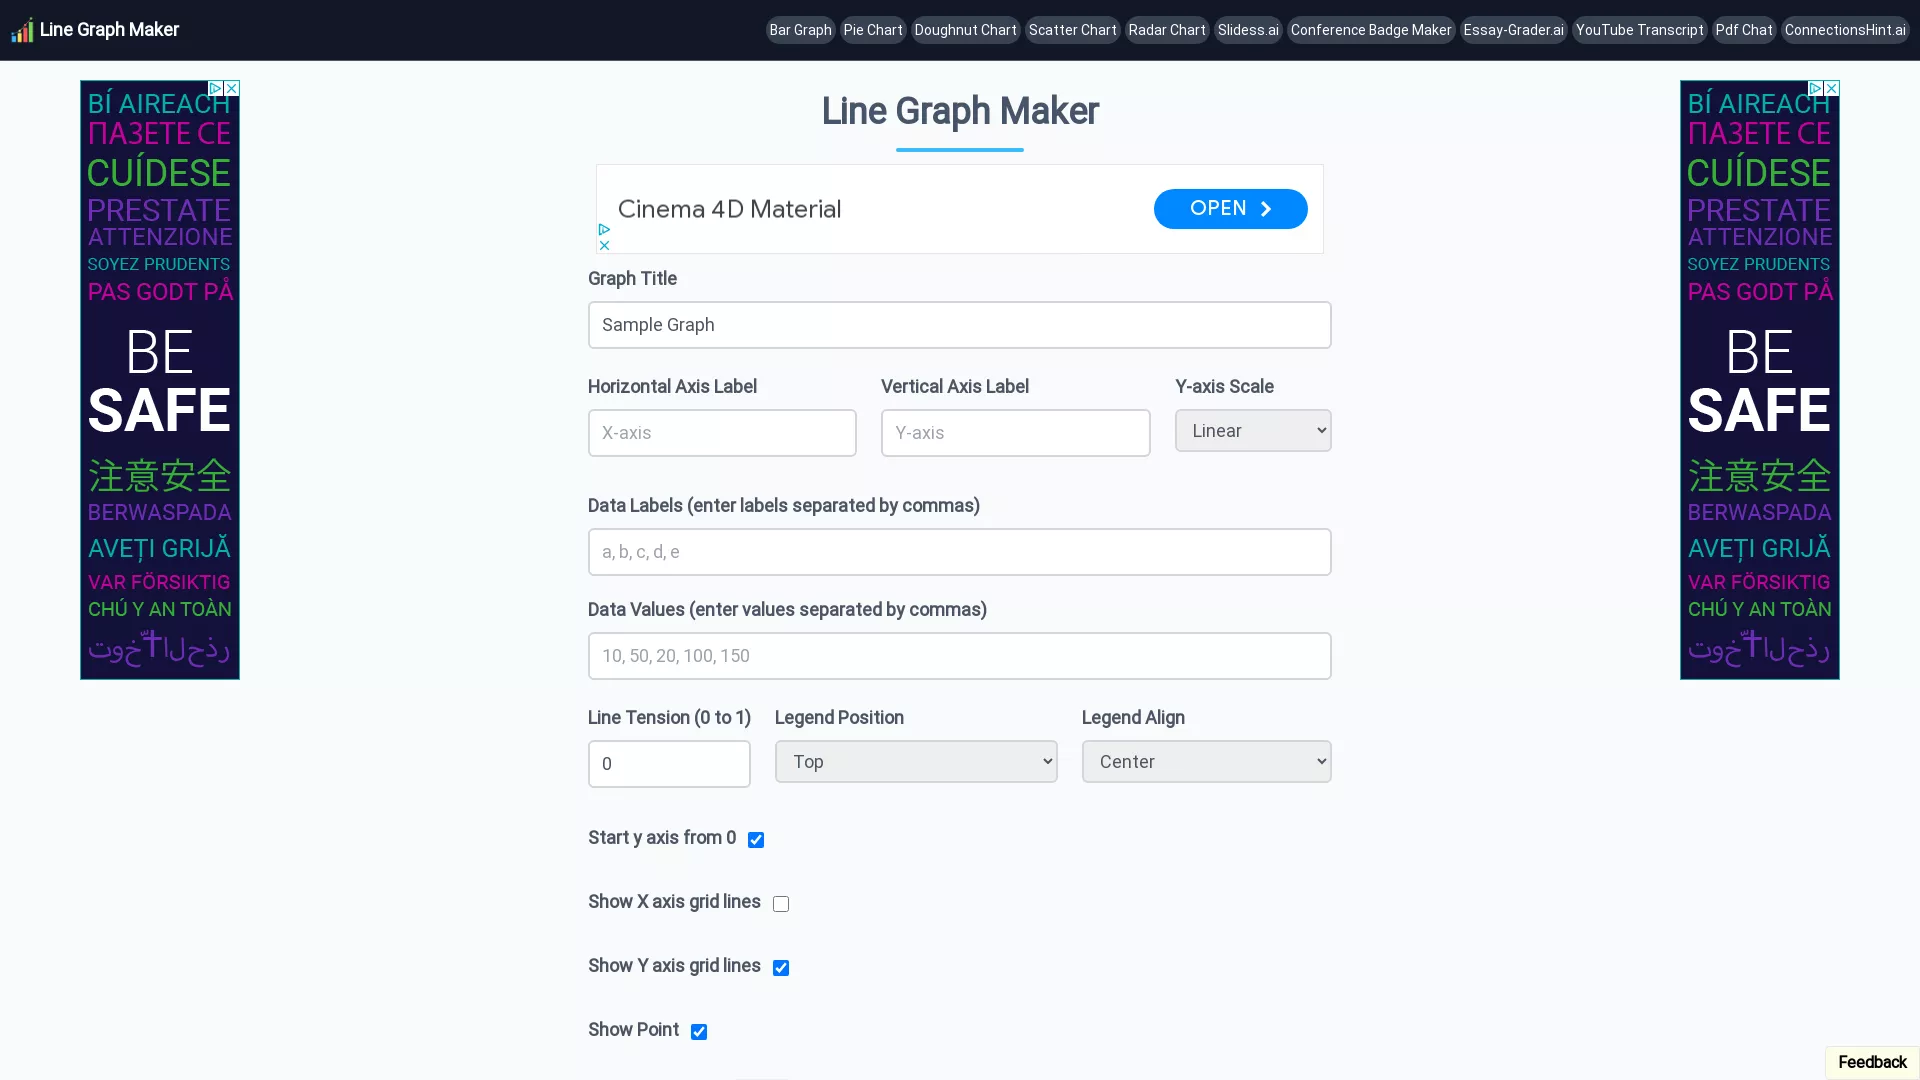
Open Line Graph Maker, add a graph title, label the horizontal and vertical axes, enter data labels and values (comma-separated), adjust line tension (0–1), choose the legend position and alignment, decide whether to start the Y axis at zero, toggle grid lines, and finally download the graph in PNG, JPG, or SVG format.
What inputs do I need to provide to set up the line graph?
You’ll need: a graph title, a horizontal axis label, a vertical axis label, data labels (entered as comma-separated values), and corresponding data values (entered as comma-separated values).
How do I enter data labels and values correctly?
Enter data labels separated by commas and enter the corresponding data values separated by commas (in the same order). Ensure the number of labels matches the number of values.
What customization options can I adjust?
You can customize: graph title, horizontal axis label, vertical axis label, y-axis scale (linear or logarithmic), line tension (0 to 1), legend position (Top, Left, Bottom, Right) and alignment (Start, Center, End), line color, showing or hiding X and Y axis grid lines, starting the Y axis from zero, and showing data points on the line.
Can I choose the y-axis scale as linear or logarithmic?
Yes. The Line Graph Maker allows you to set the Y-axis scale to linear or logarithmic.
How can I position and align the legend?
You can place the legend in one of four positions: Top, Left, Bottom, or Right. You can also adjust its alignment to Start, Center, or End.
Can I start the y-axis from zero?
Yes. You can choose to start the Y axis from zero.
How do I show data points and set the line color?
You can enable showing data points on the line and select a color for the line.
In which formats can I download the final graph?
You can download the finished line graph in PNG, JPG, or SVG formats.