Kanaries
AI Data Visualization Tool
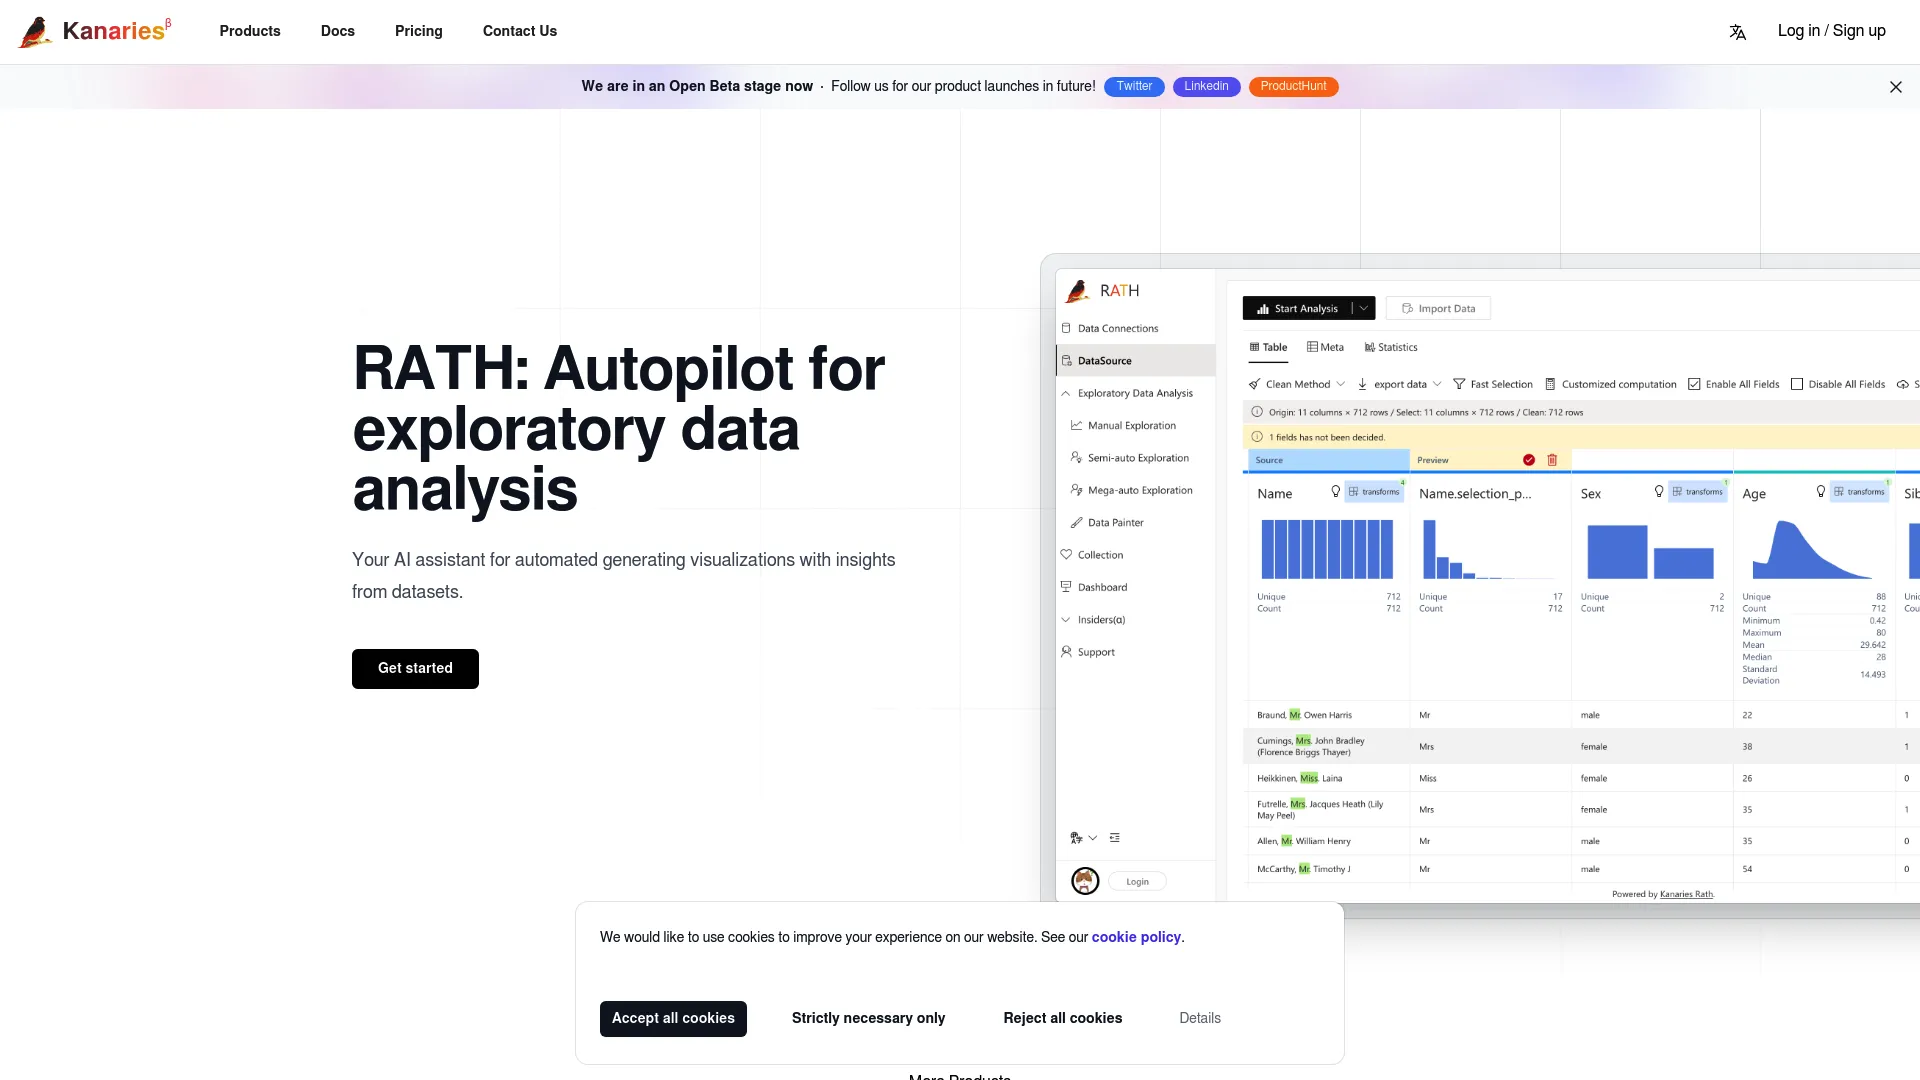
Kanaries RATH: Autopilot for exploratory data analysis. AI assistant for automated visualizations and insights from datasets. Discover patterns, insights, and causals with one click.
What does Kanaries do?
What features does Kanaries offer for data visualization?
Kanaries provides an AI-powered workspace to transform data into insights. Key capabilities include on-flight data exploration with drag-and-drop abilities, VizChat for AI-driven natural language insights, and the option to share your data and charts with your team for collaborative decision-making.
What is VizChat and how does it help me explore data?
VizChat allows you to explore data by chatting with AI to gain insights. Users can ask questions in natural language and receive answers that help in understanding their data better, offering an intuitive way to handle data analysis without technical complexity.
How can I connect my data and start exploring with Kanaries?
You can upload a file, connect to a database, or use a provided demo dataset. In the Data Source tab, you can view, edit, and explore your data. To generate automated insights, click Start Analysis in the Data Source tab to trigger Mega-auto Exploration, where charts are automatically generated after the dataset is analyzed. You can also use RATH as a data exploration copilot in Semi-auto Exploration for relevant recommendations.
How do I generate automated insights with Kanaries?
In the Data Source tab, click Start Analysis to trigger Mega-auto Exploration, which produces charts automatically after analyzing your dataset. For guided assistance, you can switch to Semi-auto Exploration where RATH acts as a data exploration copilot, learning your intent and offering recommendations.
What is RATH and what can it do?
RATH is Kanaries' Augmented Analytics engine. It can generate visualizations and insights from datasets with a single click; advanced functionalities include causal analysis and text pattern extraction.
What is PyGWalker?
PyGWalker turns your DataFrame into an interactive visual analytics app with one line of code. It supports one-line integration with pandas DataFrames, interactive drag-and-drop visualizations, and options to export and share your visualizations.
What is Graphic Walker Desktop?
Graphic Walker Desktop is a native desktop application for macOS and Windows, offering high-performance data processing and offline data analysis capabilities.
What is Graphic Walker Component?
Graphic Walker Component is an embeddable, interactive analytics component for web applications. It allows easy integration into React, Vue, or Angular apps, provides a drag-and-drop interface for end users, and supports AI-powered data exploration with chat.
What is GWalkR?
GWalkR is an interactive data visualization app for RStudio. It lets you turn R data frames into interactive exploration tools with one line of code, and it integrates with RStudio and R Markdown, featuring high-performance kernel computation.
What data sources can I connect to Kanaries?
You can upload a file, connect to a database, or use a provided demo dataset. The platform supports connecting your data through these options described in the Connect Your Data flow.
Can I share charts and collaborate with my team?
Yes. You can share your data and charts with your team to collaborate and make better decisions.
What online tools convert data files into charts?
Kanaries offers CSV to Chart Online, JSON to Chart Online, and Excel to Chart Online to help convert data files into charts quickly.
How do I start using Kanaries VizChat?
VizChat enables you to explore data by chatting with AI to gain insights. You can begin by engaging with VizChat in the Kanaries workspace and asking questions in natural language to receive AI-generated insights.
Do these tools work offline?
Graphic Walker Desktop includes offline data analysis capabilities, allowing you to work without an internet connection.
Where can I find documentation and tutorials?
Documentation and tutorials are available via View Docs on the Kanaries site.
Is there a trial available to try Kanaries?
Yes, you can Start Your Trial to explore the platform.
Are there additional resources to learn about Kanaries tools?
Yes. The platform offers an array of tools (such as PyGWalker, Graphic Walker Desktop, Graphic Walker Component, and GWalkR) and a docs section to help you get started and deepen your usage.