
Online Tone Generator
Audio AI Tools
Generate precise tones in your browser—choose a frequency, waveform, and volume to test tuning, audio gear, or hearing range.
- Pricing
- Free
- Category
- Audio
- Listed
- Aug 31, 2026
- Updated
- Sep 1, 2026
What does Online Tone Generator do?
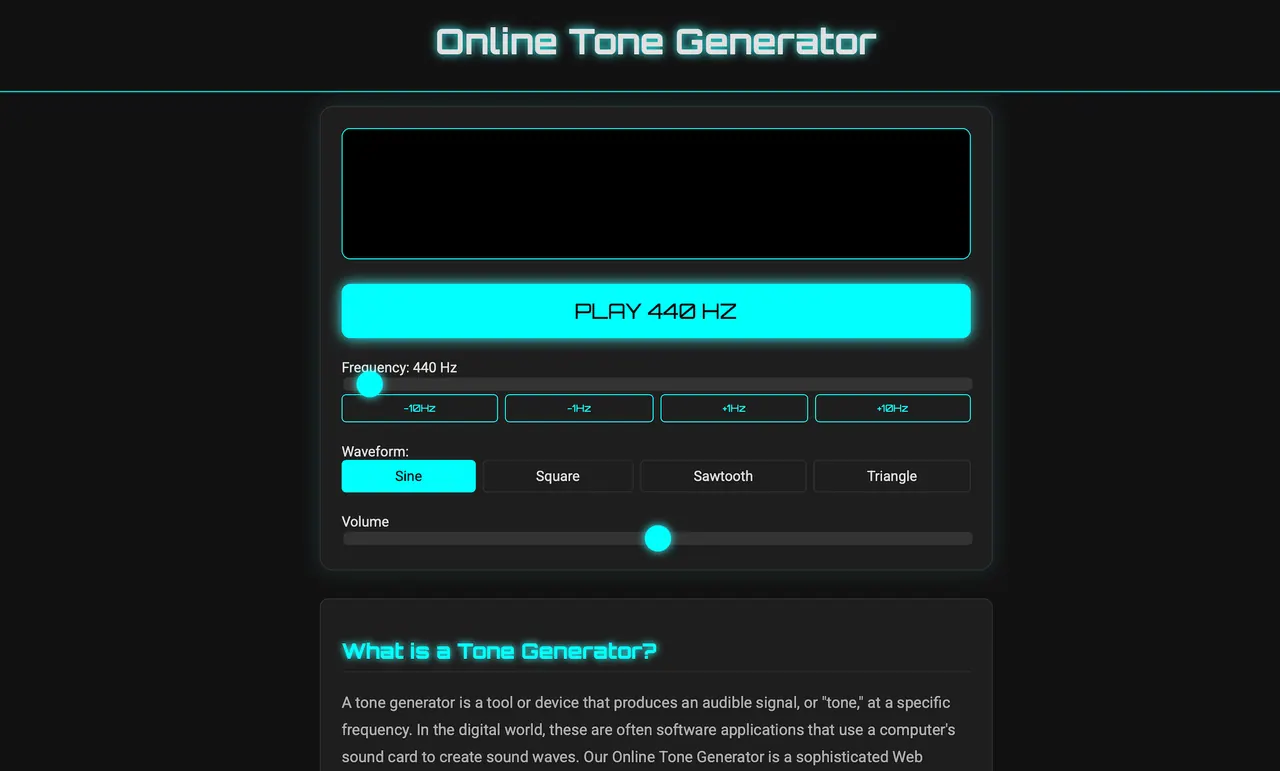
Online Tone Generator is a web app that produces audible test tones at specific frequencies directly in your browser using the built-in Web Audio API. Click Play to start with the default 440 Hz pitch, then adjust the Frequency control in real time for precise Hertz-level changes.
Use it for instrument tuning (A4 at 440 Hz), audio equipment testing with frequency sweeps to spot response issues in speakers, subwoofers, and headphones, or for science and education demonstrations about frequency, amplitude, and waveform shape. An oscilloscope-style visualizer shows a live graph of the sound wave you’re creating.
Choose from four fundamental waveform types—Sine, Square, Sawtooth, and Triangle—to hear different timbres and harmonic structures. Adjust volume with the on-page control, and fine-tune using the provided +/- 1 Hz and +/- 10 Hz steps.
How do I generate the standard 440 Hz tuning tone?
Open the generator and click Play to start at the default 440 Hz tone, then use the frequency fine-tune controls if you need small adjustments.
What waveform types are available, and how do they affect the sound?
You can select Sine, Square, Sawtooth, or Triangle. Each waveform has a different timbre and harmonic structure, with Sine producing a smoother tone and the others adding more overtones.
Can I adjust the pitch in small increments?
Yes—use the fine-tune buttons for +/- 1 Hz and +/- 10 Hz to make precise pitch adjustments after starting playback.
What can I use this for besides tuning instruments?
Common uses include testing audio equipment with frequency sweeps, demonstrating sound wave concepts in education, and running non-medical checks of hearing range.
Does the tool require specialized software or hardware downloads?
No—tones are generated in your browser via the Web Audio API, so you can run it without specialized downloads.
What does the oscilloscope visualizer show?
It displays a live graph of the sound wave being produced, helping you connect what you hear with the waveform shape.
Is this your tool?
Upgrade Online Tone Generator to Pro for featured-first placement, a newsletter feature and ongoing listing management.