GraphMaker
Data Visualization Tool
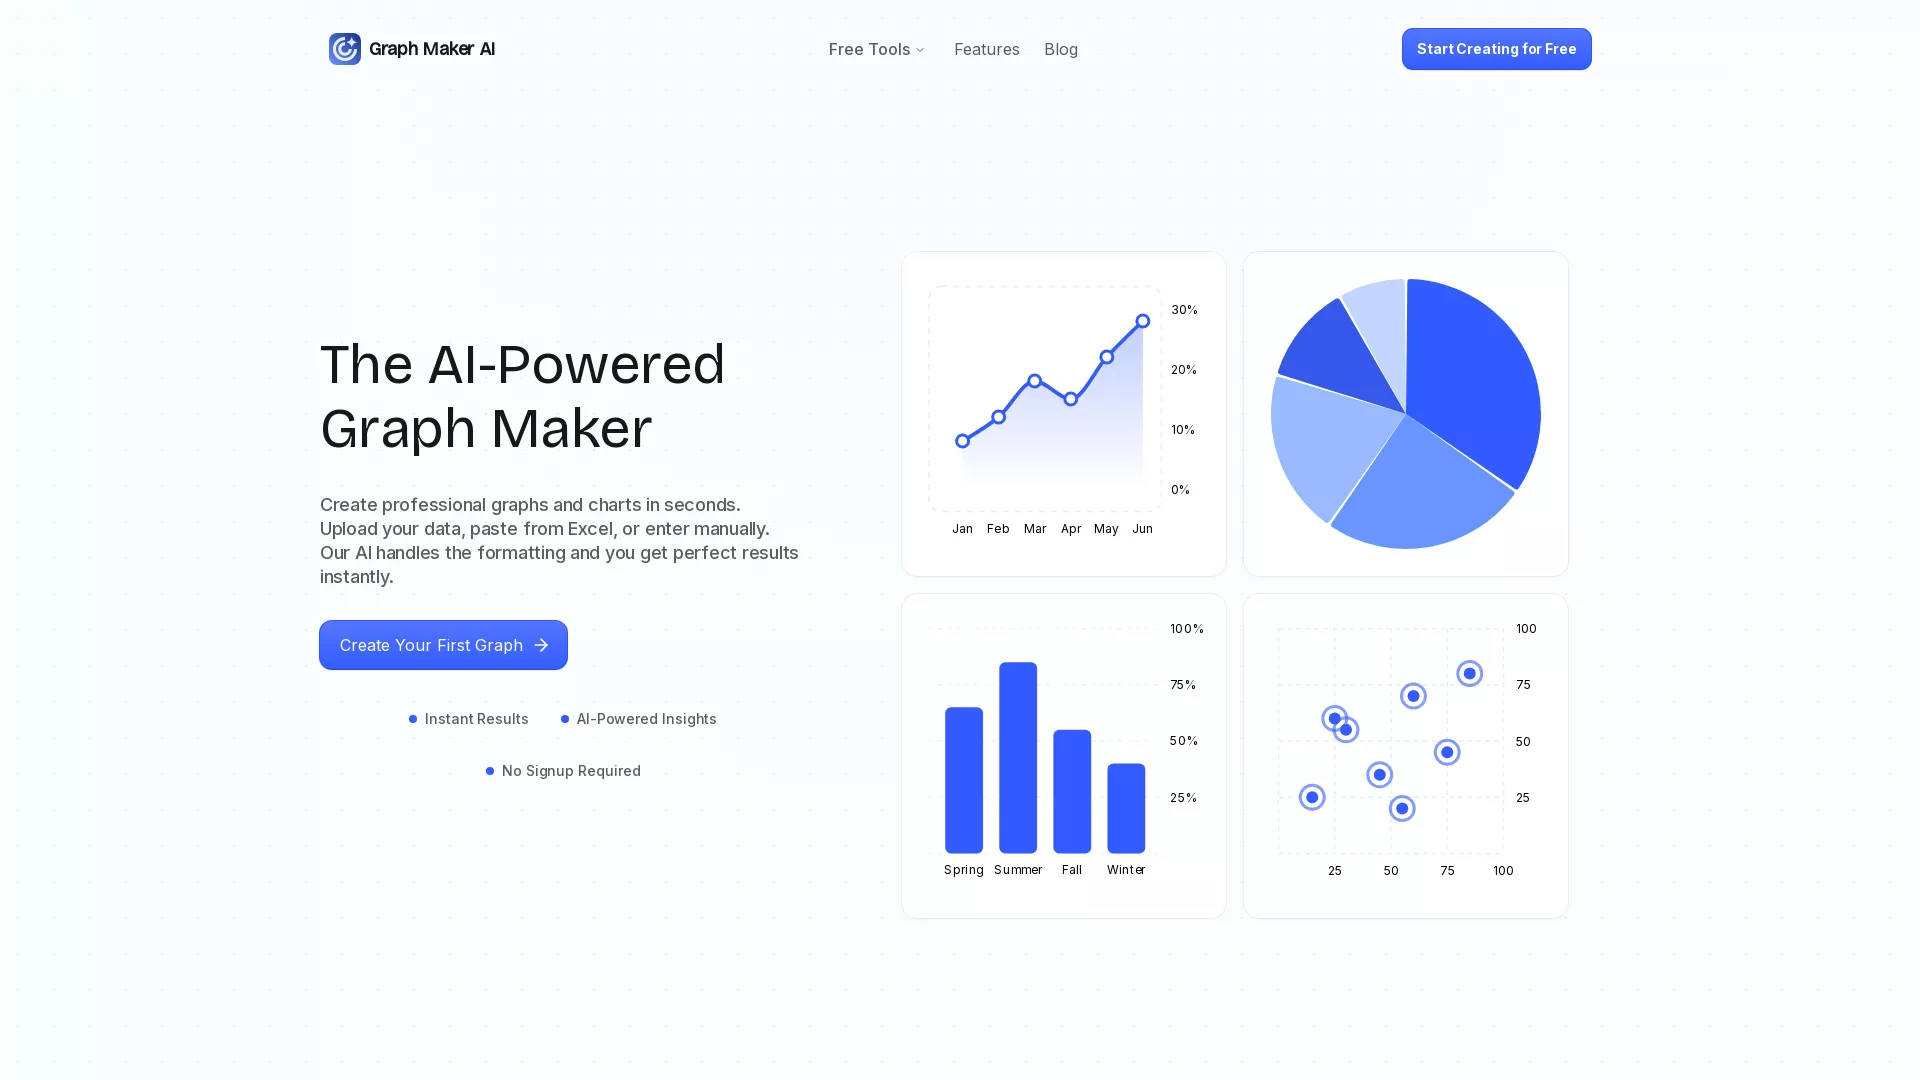
Create professional graphs and charts in seconds.
What does GraphMaker do?
What is the main use case for Graph Maker?
- Business & Marketing
Visualize website traffic, conversion funnels, and campaign performance Create charts for pitch decks, investor updates, and board reports
- Data Analysis & Operations
Quickly explore datasets without setting up complex tools Identify trends, correlations, and anomalies in operational data Generate AI-powered insights for internal decision-making
- Education & Research
Help students visualize data for assignments and presentations Create charts for academic papers or research summaries Explain data trends clearly in lectures and teaching materials
What are some unique features of graph-maker.ai?
Instant Results: Paste your data and click Generate to create AI-powered graphs in seconds.
Fully Editable Graphs: Customize every detail of your graph, including themes, labels, legends, and sizes.
Automatic AI Insights: AI generates clear insights from your data, explaining trends, proportions, distributions, and correlations.
Multiple Graph Types: Choose from line graphs, pie charts, bar graphs, and scatter plots to best fit your data.
Real-Time Graph Updates: Make changes to your data and watch your graphs update instantly.
Multiple Export Formats: Download graphs as high-resolution PNG, SVG, or PDF.
Privacy & Security: Your data is processed in your browser and never stored on our servers.
Can a user use Graph Maker for free?
yes